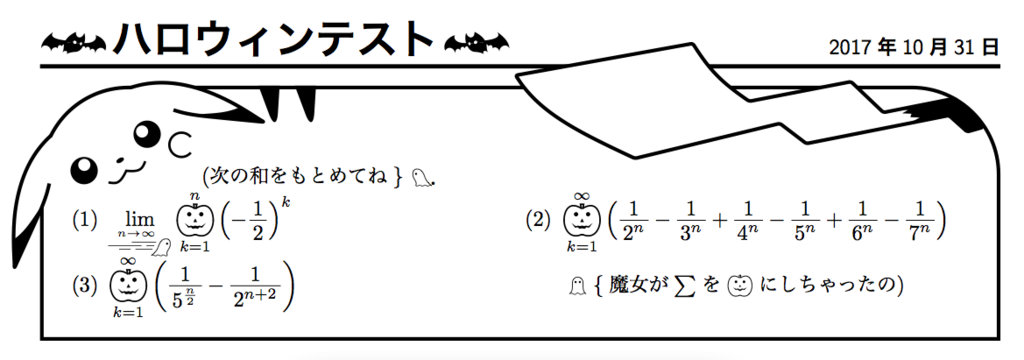
halloweenmathパッケージの紹介をします.
こんな感じに数式をデコることができます(ピカチュウは関係ないです) ω

以下からzipをダウンロードします. https://ctan.org/pkg/halloweenmath
zipを解凍したあとで,cdして次を実行すれば.halloweenmath.styがコンパイルされます.
$latex halloweenmath.ins
みなさんもデコってみてください ω
halloweenmathパッケージの紹介をします.
こんな感じに数式をデコることができます(ピカチュウは関係ないです) ω

以下からzipをダウンロードします. https://ctan.org/pkg/halloweenmath
zipを解凍したあとで,cdして次を実行すれば.halloweenmath.styがコンパイルされます.
$latex halloweenmath.ins
みなさんもデコってみてください ω
巷に溢れるtikzでつくられた図版は,簡単すぎたり複雑すぎたりと実用的でないものが多い気がします.
なので,自分のつくった幼い図版にも意外な需要があるのではと思い公開します ω


以下がコードです.最低限のプリアンブルにはなってないと思います. こんなに適当なのに,案外まともな図版が描けるということを感じてくれればうれしいです ω
\documentclass[12pt,a4j,papersize,uplatex,fleqn,dvipdfmx]{standalone}
% 書式を standalone とすれば,余白を切り取ってくれるんですね ^^;
\usepackage{bm}

\usepackage{graphicx}
\usepackage[dvipsnames]{xcolor}
\usepackage{tkz-linknodes}
\usepackage{tikz,pgfplots}
\usetikzlibrary{arrows,shapes,intersections,angles,calc,quotes,through,decorations.text}

\begin{document}

\begin{tikzpicture}[domain=-2:4,yscale=1,samples=200,>=latex,thick]
  % \clip (0,0) rectangle (5,5);% 切り抜き
  \draw[thick,->] (-1,0) -- (4,0) node[right] {$x$};% x軸
  \draw[thick,->] (0,-1) -- (0,4) node[below left] {$y$};% y軸
  \draw (0,0) node[below left] {O};% 原点

  \coordinate (O) at (0,0);

  \draw[domain=-0.5:2,color=black] plot (\x, {2*\x}) node[right] {$y=2x$};
  \draw[domain=-1:4,color=black] plot (\x, {-2/3*\x+2}) node[right] {$2x+3y=6$};
  \draw[domain=-1:4,color=black] plot (\x, {3/2}) node[right] {$y=\dfrac{3}{2}$};

  \coordinate (A) at (1,2);
  \coordinate (O) at (3/4,3/2);
  \coordinate (B) at (2,3/2);
  \coordinate (C) at (2,2/3);

  \pic["$\alpha$",draw=black,->,very thick,angle eccentricity=1.4,angle radius=8mm] {angle=B--O--A};
  \pic["$\beta$",draw=black,->,thick,angle eccentricity=1.4,angle radius=9mm] {angle=C--O--B};
\end{tikzpicture}


\begin{tikzpicture}[domain=-2:4,yscale=1,samples=200,>=latex,thick]
  % \clip (0,0) rectangle (5,5);% 切り抜き
  \draw[thick,->] (-2,0) -- (4,0) node[right] {$x$};% x軸
  \draw[thick,->] (0,-2) -- (0,6) node[below left] {$y$};% y軸
  \draw (0,0) node[below left] {O};% 原点

  \draw (0,0) circle[radius=10mm];

  \coordinate (O) at (0,0);
  \coordinate (A) at (5/2,12/2);
  \coordinate (B) at (4/2,-3/2);
  \coordinate (C) at (77/65,21/65);

  \fill (A) circle (2pt) node[right] {$\mathrm{A}(5,12)$};% 点
  \fill (B) circle (2pt) node[right] {$\mathrm{B}(4,-3)$};% 点
  \fill (C) circle (2pt) node[right] {$\mathrm{C}$};% 点

  \draw (O)--(A);
  \draw (O)--(B);
  \draw (C)--(5/13,12/13);
  \draw (C)--(4/5,-3/5);

  \draw [thick,->] (O)--(5/13,12/13) node[right] {$\dfrac{\bm{a}}{\|\bm{a}\|}$};
  \draw [thick,->] (O)--(4/5,-3/5) node[right] {$\dfrac{\bm{b}}{\|\bm{b}\|}$};

  \draw[domain=-2:3,color=black] plot (\x, {3/11*\x}) node[right] {$3x-11y=0$};
\end{tikzpicture}


\begin{tikzpicture}[domain=-2:4,yscale=0.5,samples=200,>=latex,thick]
  % \clip (0,0) rectangle (5,5);% 切り抜き
  \draw[thick,->] (-2,0) -- (4,0) node[right] {$x$};% x軸
  \draw[thick,->] (0,-4) -- (0,7) node[below right] {$y$};% y軸
  \draw (0,0) node[below left] {O};% 原点
  \draw[domain=-2:-0.36,color=black] plot (\x, {(2*\x*\x*\x+1)/(\x*\x)}) node[below left] {$y=\dfrac{2x^3+1}{x^2}$};
  \draw[domain=0.4:3,color=black] plot (\x, {(2*\x*\x*\x+1)/(\x*\x)});
  \draw[domain=-2:3,color=black,dashed,thin] plot (\x, {2*\x});
  \draw (1.2,2) node[right] {$y=2x$};
  \draw[domain=-2:4,color=black] plot (\x, {-2}) node[below] {$y=a$};
\end{tikzpicture}


\begin{tikzpicture}[domain=-2:4,scale=1,samples=200,>=latex,thick]
  % \clip (0,0) rectangle (5,5);% 切り抜き
  \draw[thick,->] (-2,0) -- (5,0) node[right] {$x$};% x軸
  \draw[thick,->] (0,-1) -- (0,9) node[below right] {$y$};% y軸
  \draw (0,0) node[below left] {O};% 原点

  \draw[domain=4.2:-2.5,color=black] plot (\x, {1/2*\x*\x}) node[right] {$C:y=\dfrac{1}{2}x^2$};
  \draw[domain=-0.5:4.4,color=black] plot (\x, {2*\x}) node[right] {$y=2x$};

  \coordinate (O) at (0,0);
  \coordinate (Q) at (2,2);
  \coordinate (R) at (2,4);
  \coordinate (P) at (1*1.2,2*1.2);

  \draw[dashed] (4,8) -- (4,0) node[below] {4};% y軸

  \draw (Q) node[right] {Q};
  \draw (R) node[above left] {R};
  \draw (P) node[left] {P};
  \draw (2,0) node[below] {$t$};

  \draw (R)--(2,0);
  \draw (O)--(P) node [midway,left] {$X$};
  \draw (P)--(Q) node [midway,below] {$Y$};

  \draw [bend left,distance=20mm,dotted] (O) to node [fill=white,inner sep=0.5pt,circle] {[$\sqrt{5}$]} (R);
  \draw [bend right,distance=10mm,dotted] (O) to node [fill=white,inner sep=0.5pt,circle] {[1]} (2,0);
  \draw [bend left,distance=20mm,dotted] (R) to node [fill=white,inner sep=0.5pt,circle] {[2]} (2,0);
\end{tikzpicture}


\begin{tikzpicture}[domain=-2:4,scale=0.5,samples=200,>=latex,thick]
  % \clip (0,0) rectangle (5,5);% 切り抜き
  \draw[thick,->] (-2,0) -- (10,0) node[right] {$x$};% x軸
  \draw[thick,->] (0,-1) -- (0,9) node[below right] {$y$};% y軸
  \draw (0,0) node[below left] {O};% 原点

  \draw[domain=4.2:-2.5,color=black] plot (\x, {1/2*\x*\x}) node[right] {$C:y=\dfrac{1}{2}x^2$};
  \draw[fill=black] (2,2) circle[radius=1mm] node[right] {$P$};
  \draw[domain=4.2:-1.5,color=black,rotate=-63] plot (\x, {1/2*\x*\x});
  \draw[fill=black,rotate=-63] (2,2) circle[radius=0.8mm] node[below] {$P'$};

  \draw[domain=-0.5:4.4,color=black] plot (\x, {2*\x}) node[right] {$y=2x$};

  \draw[dashed] (4,8) -- (4,0) node[below] {4};% y軸
  \draw (8.8,0) node[below] {$4\sqrt{5}$};
  \draw (0.2,0) node[above right] {$\theta$};

  \coordinate (O) at (0,0);

  \draw [bend left,distance=20mm,dotted] (O) to node [fill=white,inner sep=0.5pt,circle] {[$\sqrt{5}$]} (4,8);
  \draw [bend left,distance=20mm,dotted] (4,8) to node [fill=white,inner sep=0.5pt,circle] {[2]} (4,0);
  \draw [bend left,distance=15mm,dotted] (O) to node [fill=white,inner sep=0.5pt,circle] {[1]} (4,0);
\end{tikzpicture}

\end{document}
移動に便利な avy や ace-jump-mode があるのは知っているのですが,いかんせんブラインドタッチが苦手なのでストレスになります.
なので,単純にn文字カーソル移動 + M-f,M-b するのが自分にはしっくりきてます.同じような人もいるかと思い,教えてもらったコードを公開します ω
;; n文字移動
(defun my-forward-char-n (n)
    (when (eolp)
      (forward-char 1)
      (setq n (1- n)))
    (while (and (not (eolp)) (not (zerop n)))
      (forward-char 1)
      (setq n (1- n))))
(defun my-backward-char-n (n)
    (when (bolp)
      (backward-char 1)
      (setq n (1- n)))
    (while (and (not (bolp)) (not (zerop n)))
      (backward-char 1)
      (setq n (1- n))))

;; キーバインドの設定例
(bind-key "C-j" (lambda () (interactive) (my-forward-char-n 10)))
(bind-key "M-j" (lambda () (interactive) (my-backward-char-n 10)))
とりあえず以下をプリアンブルに加えよう.自分好みに調節してください ω
% 数式(演算子など)のスペースを詰める
% =,→ 間の余白
\thickmuskip=1.0\thickmuskip
% +,- 間の余白
\medmuskip=0.8\medmuskip
% … などの装飾記号の余白
\thinmuskip=0.8\thinmuskip
% 行列を詰める
\arraycolsep=0.3\arraycolsep
% 数式の上下のスペースの変更
\AtBeginDocument{
  \abovedisplayskip     =0.5\abovedisplayskip
  \abovedisplayshortskip=0.5\abovedisplayshortskip
  \belowdisplayskip     =0.5\belowdisplayskip
  \belowdisplayshortskip=0.5\belowdisplayshortskip}
数式の上下のスペースの変更で以下のように設定しているものをよく見かけますが,せっかくのグルーが消えちゃうからよくない?
\setlength{\abovedisplayskip}{0pt}
\setlength{\belowdisplayskip}{0pt}
加えたもの.行列はわかりやすいですね.


加えなかったもの


ソースファイルです.文脈は無視してください ω
\documentclass[11pt,a4j,papersize,uplatex,fleqn,dvipdfmx]{jsarticle}
\usepackage{amsmath,amssymb,amsthm,enumerate}

\begin{document}
\begin{align}
  a&=160+x, & b&=160+y & & \label{16_3}
\end{align}
とおく.データの平均値が160なので
\begin{align*}
  160&=\frac{1}{7}\left( a+b+152+158+160+162+163 \right)\\
     &=\frac{1}{7}\left\{ (160+x)+(160+y)+(160-8)+(160-2)+160+(160+2)+(160+3) \right\}
\end{align*}
両辺に7をかけて
\begin{align}
  160\cdot 7&=160\cdot 7+\left( x+y-8-2+2+3 \right) & \therefore\quad
  x+y&=5 & & & \label{16_1}
\end{align}
が分かる.また,データの標準偏差が$\sqrt{14}$なので
\begin{align}
  14\cdot 7=x^2+y^2+81 \quad\quad \therefore\quad
  x^2+y^2=17 \label{16_2}
\end{align}
が分かる.% \eqref{16_1}より$y=5-x$を\eqref{16_2}に代入して$y$を消去すると
直線$y=2x$の傾きは2,直線$2x+3y=6$の傾きは$-\dfrac{2}{3}$なので
\begin{align*}
\tan{\alpha}&=2, & \tan{\beta}&=-\frac{2}{3} & & &
\end{align*}
とおく.このとき
\begin{align*}
  \tan{\left\{ \alpha+ \left( \alpha-\beta \right) \right\}}
  &=\frac{\tan{\alpha}+\tan{\left( \alpha-\beta \right)}}{1-\tan{\alpha}\cdot\tan{\left( \alpha-\beta \right)}}\\
  &=\frac{2-8}{1-2\cdot(-8)}\\
  &=-\frac{6}{17}
\end{align*}
また,$y=2x$と$2x+3y=6$の交点の座標は
\begin{align*}
 \left(
 \begin{array}{cc}
  2 & -1 \\
  2 & 3
 \end{array}
 \right)
&%
 \left(
 \begin{array}{c}
  x \\
  y
 \end{array}
 \right)
=
 \left(
 \begin{array}{c}
  0 \\
  6
 \end{array}
 \right)
%
& \left(
 \begin{array}{c}
  x \\
  y
 \end{array}
 \right)
%
&=\frac{1}{6+2}
%
 \left(
 \begin{array}{cc}
  3 & 1 \\
  -2 & 2
 \end{array}
 \right)
 \left(
 \begin{array}{c}
  0 \\
  6
 \end{array}
 \right)
\end{align*}
したがって求める図形は,$\left(\dfrac{3}{4},~\dfrac{3}{2}\right)$を通る傾き$-\dfrac{6}{17}$の直線なので
\begin{align*}
y-\frac{3}{2}&=-\frac{6}{17}\left( x-\frac{3}{4} \right) &
&\frac{1}{2}\left(2y-3\right)=-\frac{6}{17}\cdot\frac{1}{4}\left(4x-3\right)\\
17(2y-3)&=-3(4x-3) & &\therefore\quad 6x+17y-30=0
\end{align*}
と分かる.
\end{document}
じぶんは足し算引き算などの数値計算が致命的なレベルで苦手なので,暗算で合計点を計算することができません.そのためにいくつか工夫をして合計点を算出しているのですが,それを公開します.
ただこのやり方は,大半の人にとっては面倒なだけだと思います ω
たとえば,大問が1から5まである試験の採点をすることを考えましょう.
以下のようなcsvファイルを用意します.

表計算ソフトで開くとこんな感じ(値が大きくて0になってます).

まずは,正答なら1,誤答なら0を打ち込みます.このとき,△なら適当なアルファベットに点数を対応させます(aは1点,bは2点としています).

次に,シェルスクリプトを使って数字の間にカンマを入れます.

これを,表計算ソフトで開くと以下のようになります.

あとは,配点分だけ列をかけます.

残ったアルファベットを置換して,合計点をだせば完了です.

ちなみに以下がカンマを入れるスクリプトです.comma.sh などと名前をつけて使ってください.
#!/bin/sh

target="$1"
targetwithoutext="${1%.csv}"
echo "target: $target"
echo "targetwithoutext: $targetwithoutext"

place=`dirname $target`
echo "place of target: $place"

cat $target | env -i sed -e 's/[a-z0-9]/,&/g' | env -i sed -e 's/,,*/,/g' | env -i sed -e 's/^[ ,][ ,]*//g' > "${targetwithoutext}-comma.csv"
~ $ ./comma.sh ~/Desktop/class.csv
入力モードによってモードラインの色を切替えるものばかりが目につくのですが、設定が複雑なわりに視認性の向上に貢献してない気がします ω
以下の設定をinit.elなどに加えてください.
hlinum.el をつかってます.
https://github.com/tom-tan/hlinum-mode/blob/master/hlinum.el
(require 'hlinum)
(custom-set-variables '(global-linum-mode t))
;; 色の変更
(custom-set-faces
 '(linum-highlight-face ((t (:foreground "black"
                             :background "green2")))))
(hlinum-activate)


;; カーソルの色と形を入力モードにより変える
(add-hook 'input-method-activate-hook
          (lambda() (setq default-cursor-type 'hollow)
                    (custom-set-faces; hlinum の色変更
                     '(linum-highlight-face ((t (:foreground "black"
                                                 :background "magenta1")))))))

(add-hook 'input-method-inactivate-hook
          (lambda() (setq default-cursor-type 'box)
                    (custom-set-faces; hlinum の色変更
                     '(linum-highlight-face ((t (:foreground "black"
                                                 :background "green2")))))))

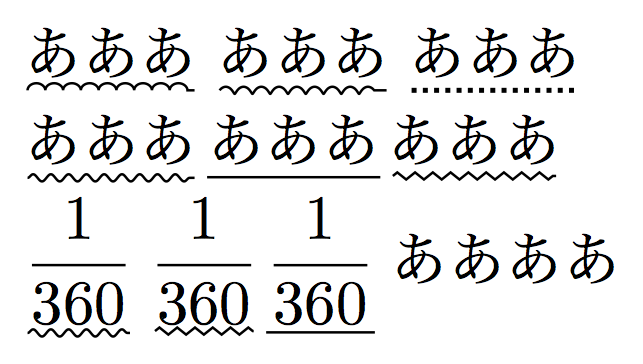
\ubumps{あああ}\ucoil{あああ}\udot{あああ}\\
\usnake{あああ}\underline{あああ}\uzigzag{あああ}\\
\usnake{$\dfrac{1}{360}$}\uzigzag{$\dfrac{1}{360}$}\underline{$\dfrac{1}{360}$}ああああ
下のやつをプリアンブルなどに貼り付ければ,上の記述で下線が使えます.latexには多くの下線パッケージがあるのですが,どれも気に食わなかったので作りました ω
参考というかほとんどパクった記事↓ tex.stackexchange.com
\newcommand{\udot}[1]{%
    \tikz[baseline=(todotted.base)]{
        \node[inner sep=1.5pt,outer ysep=0pt,outer xsep=-2pt] (todotted) {#1};
        \draw[densely dotted,thick] (todotted.south west) -- (todotted.south east);
    }%
}%

\newcommand{\uzigzag}[1]{%
    \tikz[baseline=(todotted.base)]{
        \node[inner sep=1.2pt,outer ysep=0pt,outer xsep=-2pt] (todotted) {#1};
        \draw[decorate,decoration={zigzag,amplitude=0.2mm,segment length=1mm}] (todotted.south west) -- (todotted.south east);
    }%
}

\newcommand{\usnake}[1]{%
    \tikz[baseline=(todotted.base)]{
        \node[inner sep=1.5pt,outer ysep=0pt,outer xsep=-2pt] (todotted) {#1};
        \draw[decorate,decoration={snake,amplitude=0.2mm,segment length=1mm}] (todotted.south west) -- (todotted.south east);
    }%
}%

\newcommand{\ucoil}[1]{%
    \tikz[baseline=(todotted.base)]{
        \node[inner sep=1.5pt,outer ysep=0pt,outer xsep=-2pt] (todotted) {#1};
        \draw[decorate,decoration={coil,amplitude=0.2mm,segment length=1mm}] (todotted.south west) -- (todotted.south east);
    }%
}%

\newcommand{\ubumps}[1]{%
    \tikz[baseline=(todotted.base)]{
        \node[inner sep=1.5pt,outer ysep=0pt,outer xsep=-2pt] (todotted) {#1};
        \draw[decorate,decoration={bumps,amplitude=0.4mm,segment length=2mm}] (todotted.south west) -- (todotted.south east);
    }%
}%